> ## Documentation Index
> Fetch the complete documentation index at: https://docs.ilyama.golain.io/llms.txt
> Use this file to discover all available pages before exploring further.
# Dashboards overview
> Panels, queries, and how dashboard data flows from your table to a chart.
**Dashboards** visualize project data as a grid of **panels** — tables, line/bar/area charts, XY line charts, gauges, and stat/KPI tiles. Each panel runs a query against a project data source (usually an Omega replicated table) and renders the result.
## How a panel gets its data
```
Source table → QueryScript query → (optional) Transform SQL → Chart
```
1. **QueryScript query** — selects columns and a time window from a table. Built visually (**Build** tab) or written directly (**QueryScript YAML** tab).
2. **Transform SQL** (optional) — a DuckDB-WASM SQL step that reshapes the query's rows in the browser before charting. See [Transforming panel data](/console/dashboards/transforms).
3. **Chart** — the visualization reads whichever columns come out of step 2 (or step 1, if there's no transform). See [Linking transforms to panels](/console/dashboards/linking-panels).
Most panels only need steps 1 and 3. Reach for a transform when your raw columns don't already match what the chart needs — most commonly, decoding an encoded (bytea/base64) JSON column into plain numeric columns.
## Create a dashboard
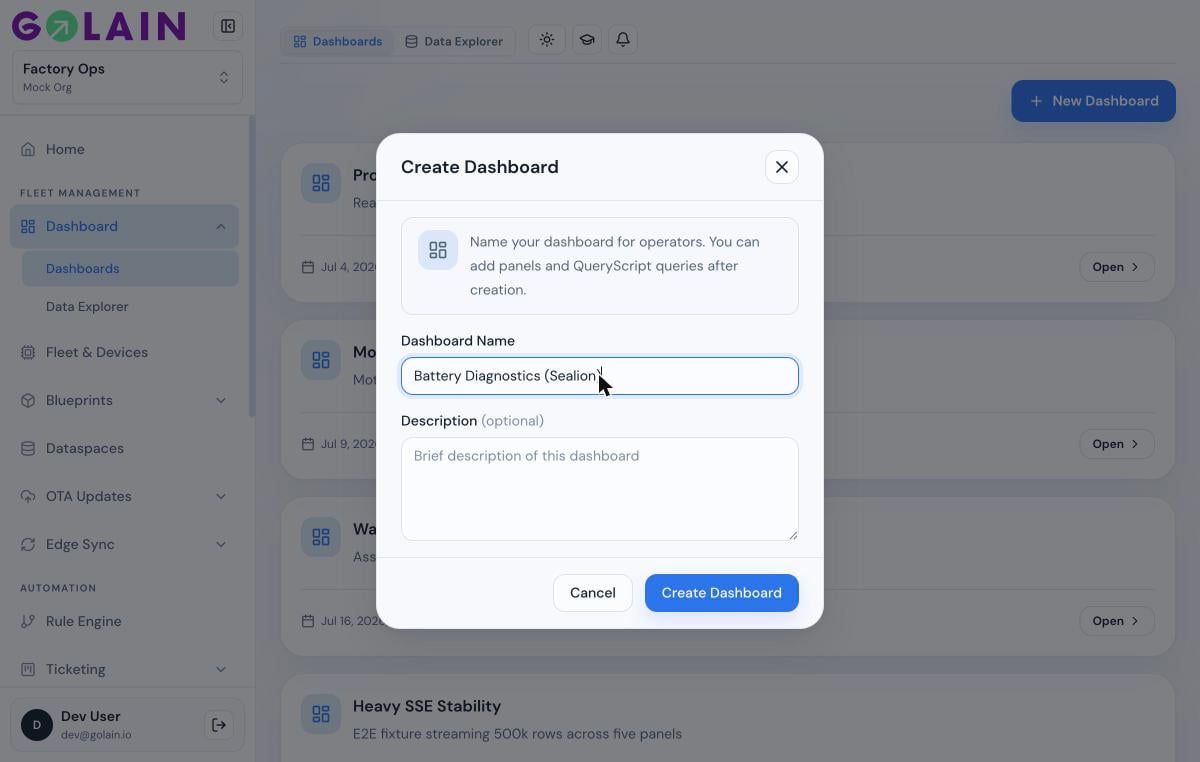
1. Open your project → **Dashboard** → **Dashboards**.
2. Click **New Dashboard**, name it, and save.
3. Click **Add Panel** to add your first panel.
 ## The panel editor
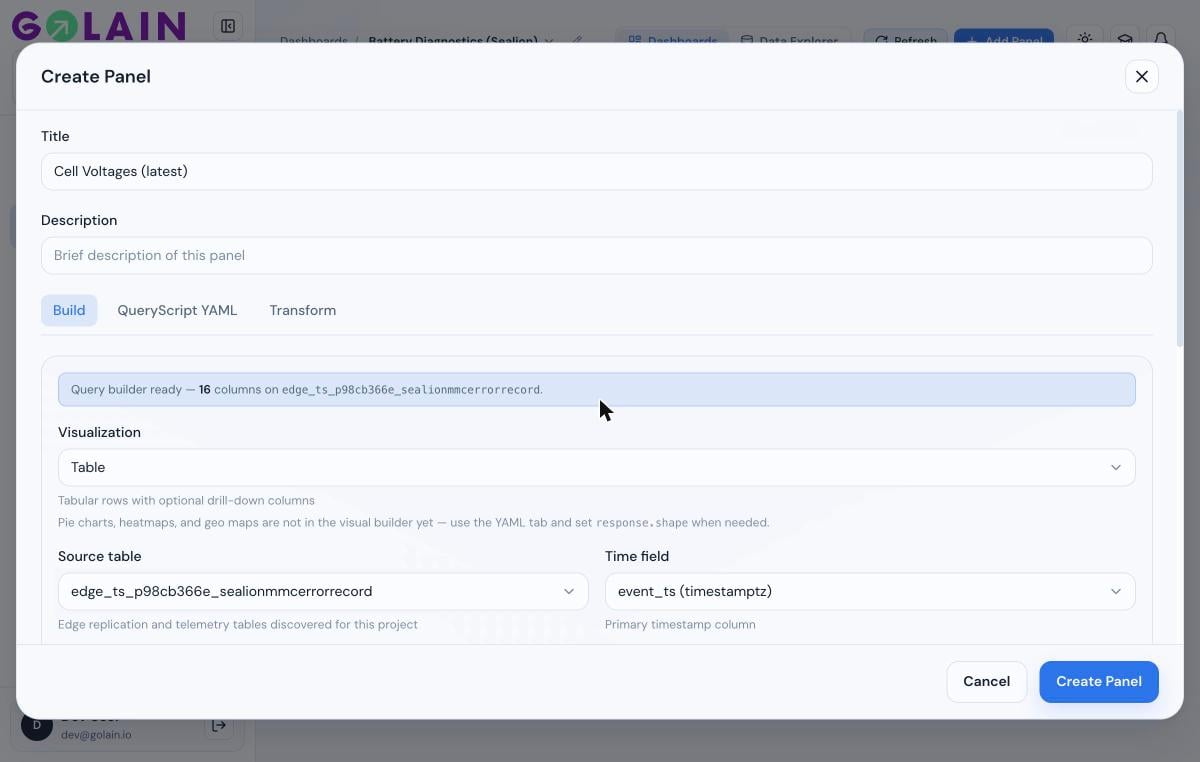
Every panel (new or existing) opens the same editor with three tabs:
| Tab | Purpose |
| -------------------- | ------------------------------------------------------------------------------------------------------------------------------------------ |
| **Build** | Visual query + chart builder — source table, time field, columns, visualization type, axis/measure mapping |
| **QueryScript YAML** | The raw query as YAML. Editing here locks the visual builder — use it for shapes the visual builder doesn't cover yet (pie, heatmap, geo). |
| **Transform** | Optional DuckDB SQL that reshapes query rows before charting |
## The panel editor
Every panel (new or existing) opens the same editor with three tabs:
| Tab | Purpose |
| -------------------- | ------------------------------------------------------------------------------------------------------------------------------------------ |
| **Build** | Visual query + chart builder — source table, time field, columns, visualization type, axis/measure mapping |
| **QueryScript YAML** | The raw query as YAML. Editing here locks the visual builder — use it for shapes the visual builder doesn't cover yet (pie, heatmap, geo). |
| **Transform** | Optional DuckDB SQL that reshapes query rows before charting |
 ## Next steps
Decode encoded columns and reshape rows with DuckDB SQL.
Map transform output columns to line, bar, XY line, and gauge/stat charts.
Panel shows "No data", a chart reads 0, or a column won't map.
## Next steps
Decode encoded columns and reshape rows with DuckDB SQL.
Map transform output columns to line, bar, XY line, and gauge/stat charts.
Panel shows "No data", a chart reads 0, or a column won't map.