> ## Documentation Index
> Fetch the complete documentation index at: https://docs.ilyama.golain.io/llms.txt
> Use this file to discover all available pages before exploring further.
# Transforming panel data
> Reshape panel query rows with DuckDB SQL — decode encoded columns, unnest arrays, and build waveforms.
A panel's **Transform** is optional DuckDB SQL that runs in the browser (DuckDB-WASM) on the rows your query returns, before the chart renders them. Use it when the chart needs columns that don't exist on the raw table as-is — most commonly, an encoded telemetry column that needs decoding and flattening.
A transform reshapes rows already returned by your query. It does not change what the query selects from the database — for that, edit the **Build** or **QueryScript YAML** tab.
## When you need a transform
| Situation | Example |
| -------------------------------------------------------------------------- | ---------------------------------------------- |
| A column holds an encoded array/object (bytea or base64 JSON) | `cell_voltages` as a base64-encoded JSON array |
| A single row holds an array you want as multiple chart points | 96 cell voltages → 96 bar-chart bars |
| You want to scale, rename, or compute a derived value | `soc_1 * 100 AS soc_pct` |
| You want only the latest record, regardless of the dashboard's time filter | Gauge/stat panels showing "current state" |
If your query already returns plain numeric/timestamp columns in the shape the chart needs, skip the transform entirely.
## Write and run a transform
1. Open the panel editor → **Transform** tab.
2. Write DuckDB SQL. Your query's result rows are available as the table `raw`.
3. Click **Run transform** to execute it and preview the output.
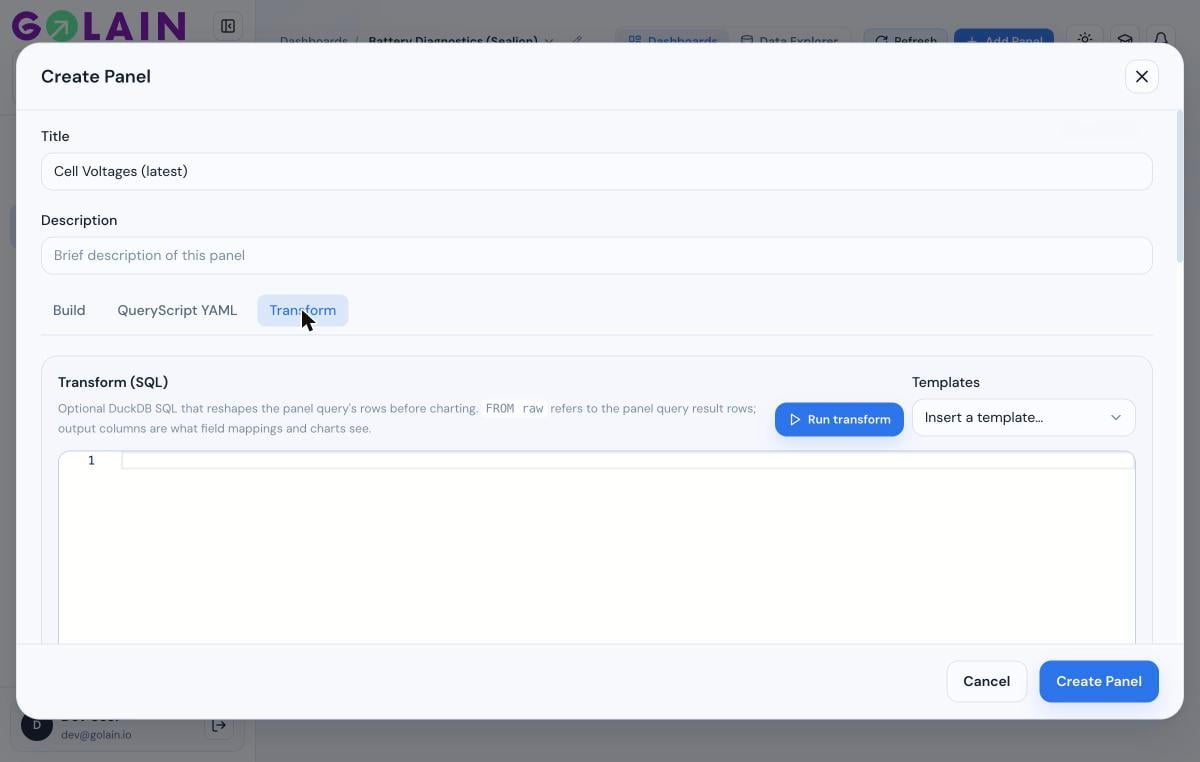 The `FROM raw` reference and the note above the editor spell this out directly: `raw` is your query's result rows, and whatever columns your final `SELECT` produces are what the chart's field mappings see next.
### Structured columns (decoding encoded telemetry)
If a column holds base64 or `\x`-hex encoded JSON (a common shape for bytea telemetry columns), mark it under **Structured columns** so it's decoded to a real array/object *before* your transform SQL runs. Columns typed `bytea` are usually auto-detected and pre-selected.
The `FROM raw` reference and the note above the editor spell this out directly: `raw` is your query's result rows, and whatever columns your final `SELECT` produces are what the chart's field mappings see next.
### Structured columns (decoding encoded telemetry)
If a column holds base64 or `\x`-hex encoded JSON (a common shape for bytea telemetry columns), mark it under **Structured columns** so it's decoded to a real array/object *before* your transform SQL runs. Columns typed `bytea` are usually auto-detected and pre-selected.
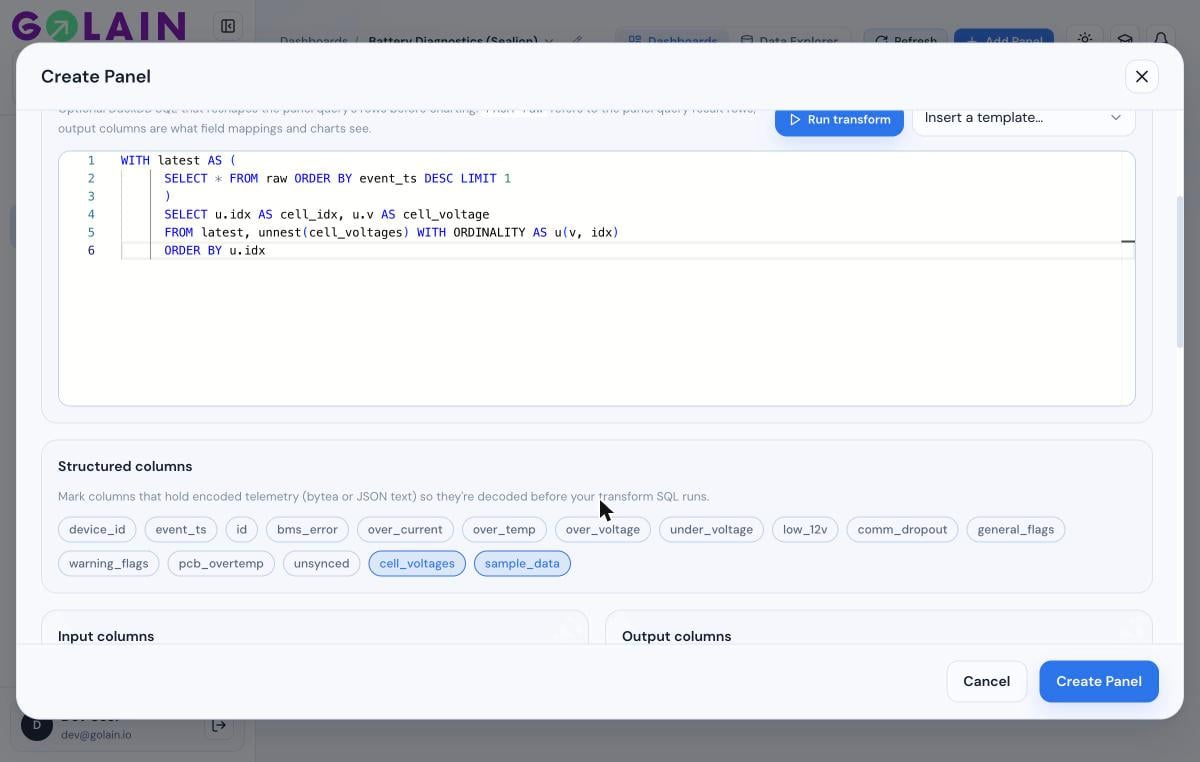 Without this step, your transform SQL would be working against a raw encoded string instead of a queryable array — `unnest()` and struct/array indexing wouldn't have anything to operate on.
### Templates
The **Templates** dropdown inserts a starting point for three common shapes:
| Template | Use for |
| ----------------------------------- | ------------------------------------------------------------------------------------------------------------------------------------ |
| **Passthrough** | No reshaping — just confirms the `raw → transform → chart` wiring |
| **Unnest array column** | Turn one array column into N rows (bar/line charts over an array, e.g. per-cell voltages) |
| **Waveform overlay (12×50 struct)** | Unroll a nested `[segment][sample]` matrix (e.g. multi-signal waveform captures) into `sample_idx`-indexed rows for an XY line chart |
Pick one, then adjust column names to match your table.
### The "latest record" pattern
Most transforms should start by pinning to the most recent row, so the panel shows current state regardless of what column names or time semantics the raw table uses:
```sql theme={null}
WITH latest AS (
SELECT * FROM raw ORDER BY event_ts DESC LIMIT 1
)
SELECT ...
FROM latest
```
The transform **preview** in the editor already fetches the latest available rows independent of the dashboard's time filter — so `Run transform` works even on a dashboard set to a narrow "Live" window with no recent data. The **saved panel**, once on a dashboard, still queries within whatever time filter is active — see [Troubleshooting: panel shows "No data"](/console/dashboards/troubleshooting#panel-shows-no-data).
## Example: unnest an array into bar-chart rows
Given a `cell_voltages` column holding a flat array of 96 floats, turn the latest row into 96 chartable rows:
```sql theme={null}
WITH latest AS (
SELECT * FROM raw ORDER BY event_ts DESC LIMIT 1
)
SELECT u.idx AS cell_idx, u.v AS cell_voltage
FROM latest, unnest(cell_voltages) WITH ORDINALITY AS u(v, idx)
ORDER BY u.idx
```
Without this step, your transform SQL would be working against a raw encoded string instead of a queryable array — `unnest()` and struct/array indexing wouldn't have anything to operate on.
### Templates
The **Templates** dropdown inserts a starting point for three common shapes:
| Template | Use for |
| ----------------------------------- | ------------------------------------------------------------------------------------------------------------------------------------ |
| **Passthrough** | No reshaping — just confirms the `raw → transform → chart` wiring |
| **Unnest array column** | Turn one array column into N rows (bar/line charts over an array, e.g. per-cell voltages) |
| **Waveform overlay (12×50 struct)** | Unroll a nested `[segment][sample]` matrix (e.g. multi-signal waveform captures) into `sample_idx`-indexed rows for an XY line chart |
Pick one, then adjust column names to match your table.
### The "latest record" pattern
Most transforms should start by pinning to the most recent row, so the panel shows current state regardless of what column names or time semantics the raw table uses:
```sql theme={null}
WITH latest AS (
SELECT * FROM raw ORDER BY event_ts DESC LIMIT 1
)
SELECT ...
FROM latest
```
The transform **preview** in the editor already fetches the latest available rows independent of the dashboard's time filter — so `Run transform` works even on a dashboard set to a narrow "Live" window with no recent data. The **saved panel**, once on a dashboard, still queries within whatever time filter is active — see [Troubleshooting: panel shows "No data"](/console/dashboards/troubleshooting#panel-shows-no-data).
## Example: unnest an array into bar-chart rows
Given a `cell_voltages` column holding a flat array of 96 floats, turn the latest row into 96 chartable rows:
```sql theme={null}
WITH latest AS (
SELECT * FROM raw ORDER BY event_ts DESC LIMIT 1
)
SELECT u.idx AS cell_idx, u.v AS cell_voltage
FROM latest, unnest(cell_voltages) WITH ORDINALITY AS u(v, idx)
ORDER BY u.idx
```
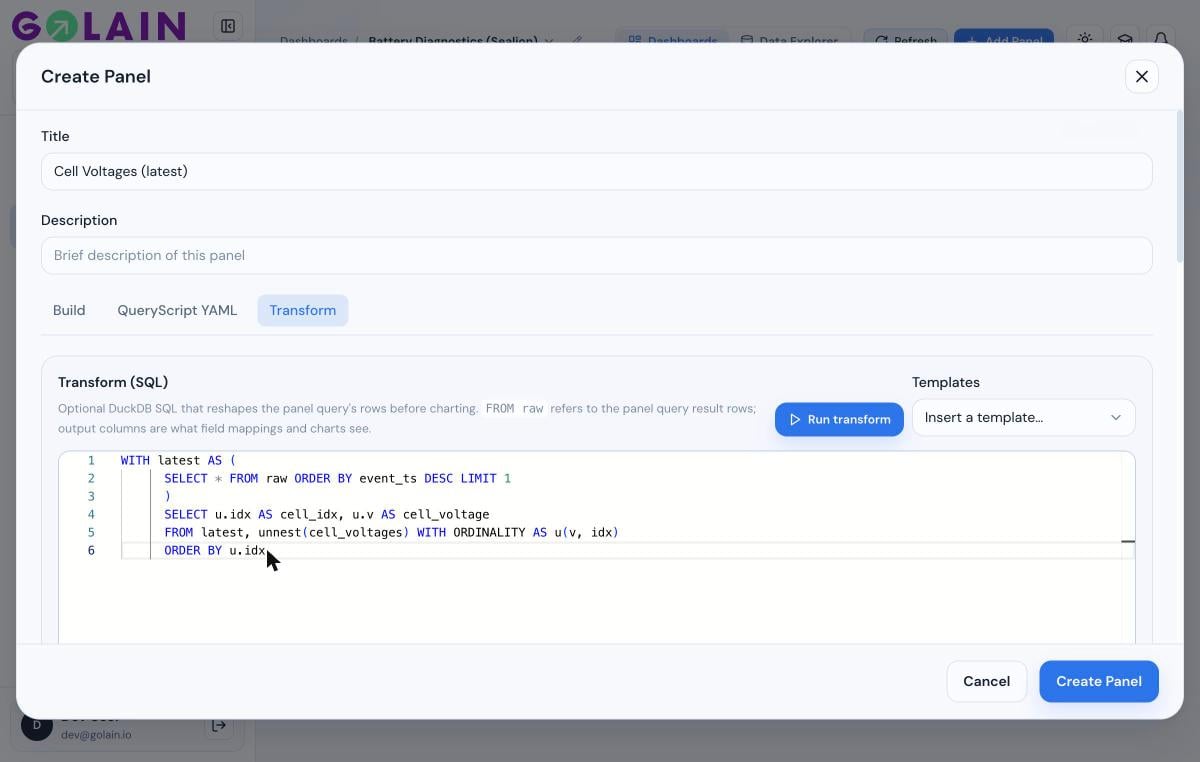 Run the transform and check **Input columns** / **Output columns** to confirm the shape:
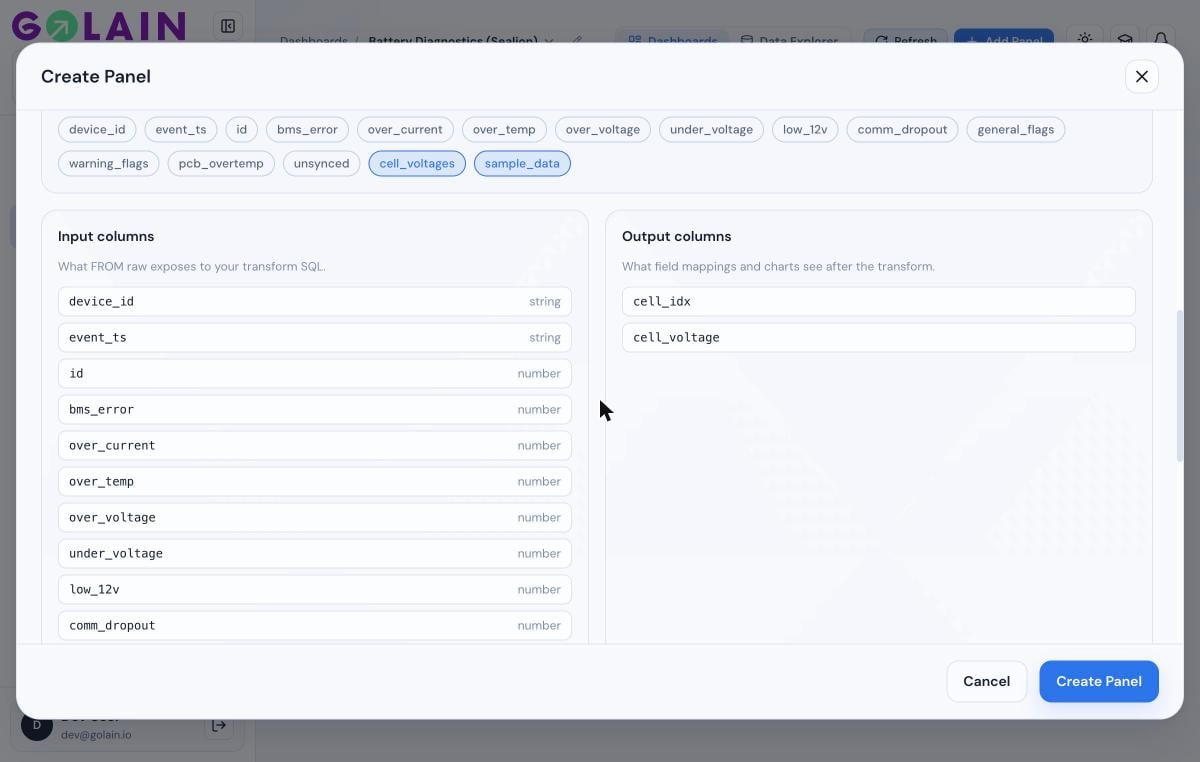 `cell_idx` and `cell_voltage` are now available to map onto a chart — see [Linking transforms to panels](/console/dashboards/linking-panels).
## Scaling or renaming a column
A transform is also the place to do simple arithmetic or aliasing — no separate "computed column" feature needed:
```sql theme={null}
WITH latest AS (
SELECT * FROM raw ORDER BY event_ts DESC LIMIT 1
)
SELECT soc_1 * 100 AS soc_1_pct
FROM latest
```
Re-run the transform after any SQL edit — the **Output columns** list and the chart's column pickers only reflect the last successful run.
## Next step
Map cell\_idx / cell\_voltage (or any transform output) onto a bar chart, line chart, or gauge.
`cell_idx` and `cell_voltage` are now available to map onto a chart — see [Linking transforms to panels](/console/dashboards/linking-panels).
## Scaling or renaming a column
A transform is also the place to do simple arithmetic or aliasing — no separate "computed column" feature needed:
```sql theme={null}
WITH latest AS (
SELECT * FROM raw ORDER BY event_ts DESC LIMIT 1
)
SELECT soc_1 * 100 AS soc_1_pct
FROM latest
```
Re-run the transform after any SQL edit — the **Output columns** list and the chart's column pickers only reflect the last successful run.
## Next step
Map cell\_idx / cell\_voltage (or any transform output) onto a bar chart, line chart, or gauge.