

A transform reshapes rows already returned by your query. It does not change what the query selects from the database — for that, edit the Build or QueryScript YAML tab.
When you need a transform
If your query already returns plain numeric/timestamp columns in the shape the chart needs, skip the transform entirely.
Write and run a transform
- Open the panel editor → Transform tab.
- Write DuckDB SQL. Your query’s result rows are available as the table
raw. - Click Run transform to execute it and preview the output.
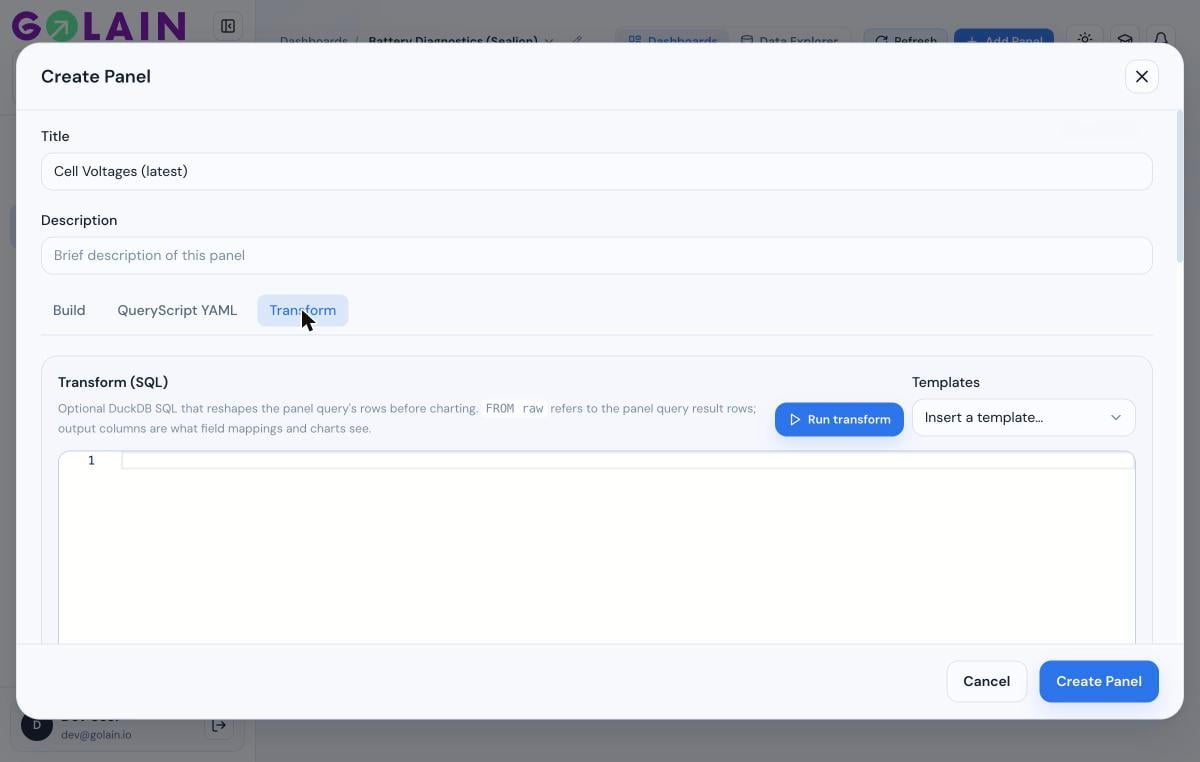
FROM raw reference and the note above the editor spell this out directly: raw is your query’s result rows, and whatever columns your final SELECT produces are what the chart’s field mappings see next.
Structured columns (decoding encoded telemetry)
If a column holds base64 or\x-hex encoded JSON (a common shape for bytea telemetry columns), mark it under Structured columns so it’s decoded to a real array/object before your transform SQL runs. Columns typed bytea are usually auto-detected and pre-selected.
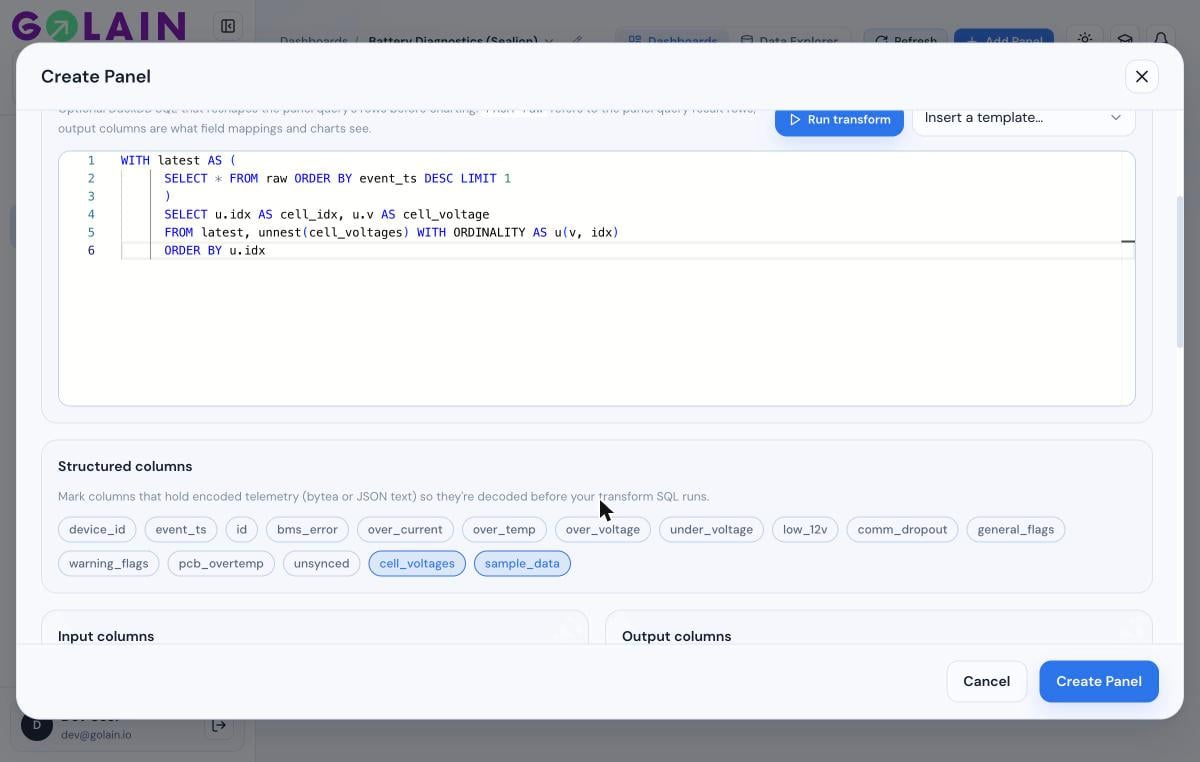
unnest() and struct/array indexing wouldn’t have anything to operate on.
Templates
The Templates dropdown inserts a starting point for three common shapes:
Pick one, then adjust column names to match your table.
The “latest record” pattern
Most transforms should start by pinning to the most recent row, so the panel shows current state regardless of what column names or time semantics the raw table uses:Example: unnest an array into bar-chart rows
Given acell_voltages column holding a flat array of 96 floats, turn the latest row into 96 chartable rows:
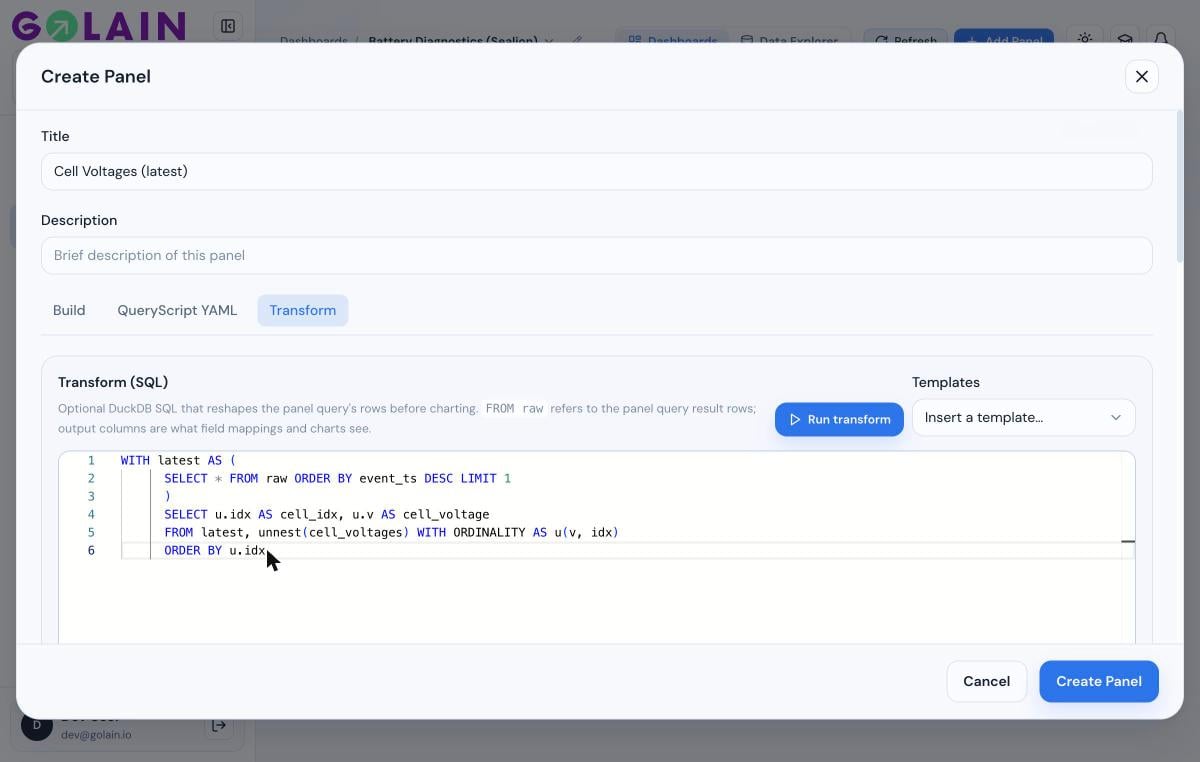
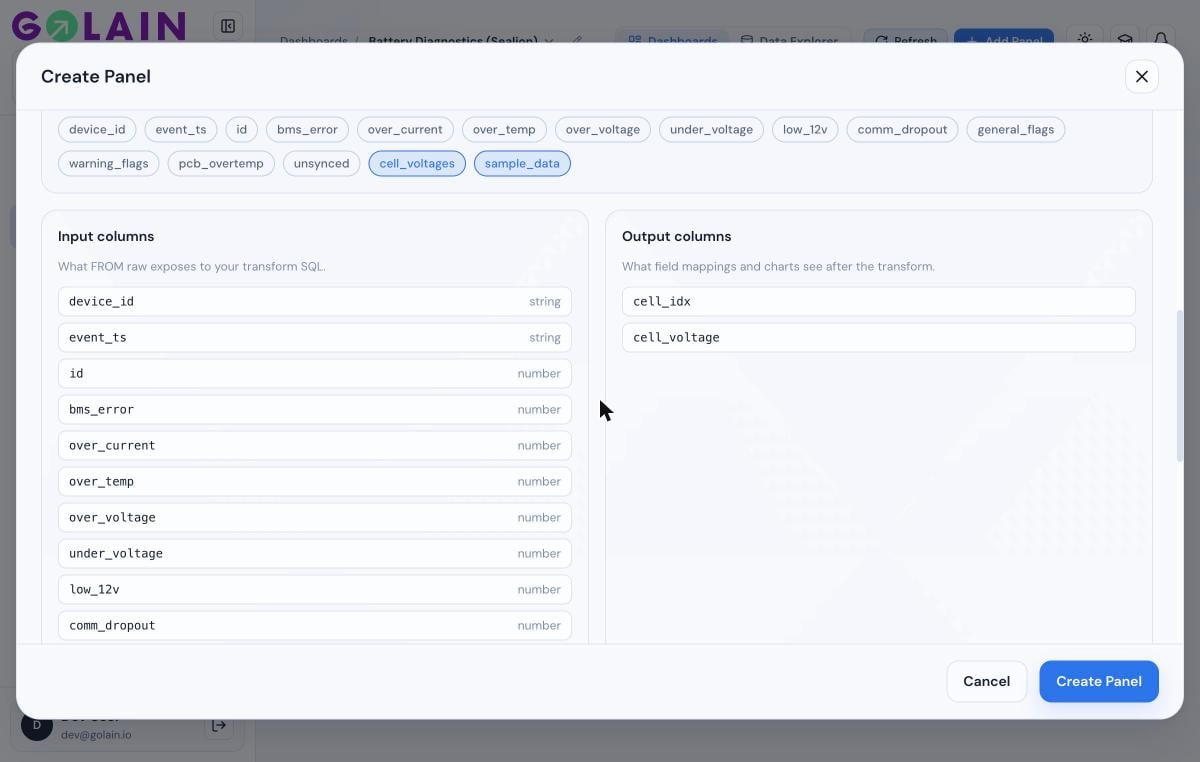
cell_idx and cell_voltage are now available to map onto a chart — see Linking transforms to panels.
Scaling or renaming a column
A transform is also the place to do simple arithmetic or aliasing — no separate “computed column” feature needed:Next step
Linking transforms to panels
Map cell_idx / cell_voltage (or any transform output) onto a bar chart, line chart, or gauge.